| BizBridges |  |
Home / BizBridges /
|
|
|
 |
| Technology |
| Why Renewable Energy Can Replace Fossil Fuel Resources |
| Author : | Nagendra Kumar Swarnkar |
| Institute : | NIT(Jaipur)(MNIT) '2 |
| Posting Date : | 23/11/09 |


|
|
|
| Total 14 vote(s). |  | |
|
|
|
|
|
Renewable energy can replace diminishing fossil fuel resources over the long run, feels the author.
|
|
|
Growth of Renewable Energy Market: A Survey Report
Nagendra Kumar Swarnkar
Reader (Department of Electrical Engg.)
Jaipur National University, Jaipur
Introduction
Renewable energy increases diversity of energy supplies and can replace diminishing fossil fuel resources over the long run. Their use in place of fossil fuels can substantially reduce greenhouse gases and other pollutants. Growth in demand for renewable energy in industrialized countries is leading to economies of scale; such growth enables increased access by the developing world. While experts believe that many new markets could sustain even higher rates of renewable energy penetration, numerous barriers remain. The cost of renewable energy technologies remains high, although it continues to fall. Some forms of renewable energy are now competitive in some market conditions.
The deployment of renewable energy requires appropriate economic, market and regulatory instruments. The diffusion and deployment of newly developed renewable energy technologies into markets are particularly important. Renewable energy markets grew robustly in 2008.
Wind Power
Wind power should be considered an important component of any long-term energy strategy, because wind power generation uses a natural and virtually inexhaustible source of power-the wind-to produce electricity. That is a stark contrast to traditional power plants that rely on fossil fuels. Wind power generation is clean; it doesnt cause air, soil or water pollution. Thats an important difference between wind power and some other renewable energy sources, such as nuclear power, which produces a vast amount of hard-to-manage waste.
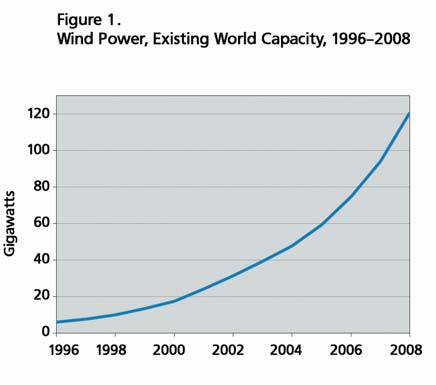
Wind power is growing at the rate of 30 percent annually, with a worldwide installed capacity of over 100 GW, and is widely used in several European countries and the United States. As the need for clean, renewable energy increases, and the world more urgently seeks alternatives to finite supplies of oil, coal and natural gas, priorities will change. As the cost of wind power continues to decline, due to technology improvements and better generation techniques, wind power will become increasingly feasible as a major source of electricity and mechanical power.
Among new renewables (excluding large hydropower), wind power was the largest addition to renewable energy capacity. Existing wind power capacity grew by 29 percent in 2008 to reach 121 giga watts (GW), more than double the 48 GW that existed in 2004. The 2008 increase was led by high growth in the strongest markets of the United States (8.4 GW added), China (6.3 GW), India (1.8 GW), and Germany (1.7 GW). (See Figures 1 and 2). Many milestones were reached in 2008. The United States overtook long-time wind power leader Germany, ending the year with 25 GW compared to Germanys 24 GW. Chinas total wind power doubled for the fifth year in a row, ending the year above 12 GW and breaching Chinas 2010 development target of 10 GW two years early.
More than 80 countries around the world had commercial wind power installations by 2008, with Mongolia and Pakistan being two of the most recent entrants to this group.
Three sub-Saharan African countries had commercial wind power installations, but projects were under development in others, including Ethiopia, Kenya, and Tanzania. Existing offshore wind capacity reached nearly 1.5 GW in 2008, virtually all of it in Europe, with 200 megawatts (MW) added in 2007 and 360 MW added in 2008. The United Kingdom became the offshore wind power leader in 2008. Small hydropower increased to an estimated 85 GW worldwide. Most of the small hydro is in China, where the boom in small hydro has continued with 4-6 GW added annually during 2004-08. Small hydro and micro-hydro development has also continued in several African and Asian countries. Large hydropower increased by an estimated 25-30 giga watts in 2008, significantly more than in previous years, led by China (12-15 GW added) and India (more than 5 GW added).
Biomass power
At present, most biomass power plants burn lumber, agricultural or construction/demolition wood wastes. Direct Combustion power plants burn the biomass fuel directly in boilers that supply steam for the same kind of steam-electric generators used to burn fossil fuels. With biomass gasification, biomass is converted into a gas - methane - that can then fuel steam generators, combustion turbines, combined cycle technologies or fuel cells. The primary benefit of biomass gasification, compared to direct combustion, is that extracted gasses can be used in a variety of power plant configurations. Because biomass technologies use combustion processes to produce electricity, they can generate electricity at any time, unlike wind and most solar technologies, which only produce when the wind is blowing or sun is shining. Biomass power plants currently represent 11,000 MW - the second largest amount of renewable energy in the nation.
Biomass power generation (and cogeneration) continued to increase at both large and small scales, with an estimated 2GW of power capacity added in 2008, bringing existing biomass power capacity to about 52 GW. Biomass power generation continued to grow in several European Union (EU) countries during 2007/2008, including Finland, France, Germany, Italy, Poland, Sweden, and the United Kingdom. China continued to increase power generation from industrial- scale biogas (i.e., at livestock farms) and from agricultural residues, mainly straw. The sugar industries in many developing countries continued to bring new bagasse power plants online, including leaders Brazil and the Philippines, and others such as Argentina, Columbia, India, Mexico, Nicaragua, Thailand, and Uruguay.
Solar Power
Solar power is produced by collecting sunlight and converting it into electricity. This is done by using solar panels, which are large flat panels made up of many individual solar cells. It is most often used in remote locations, although it is becoming more popular in urban areas as well. Grid-connected solar photovoltaic (PV) continued to be the fastest growing power generation technology, with a 70-percent increase in existing capacity to 13 GW in 2008. This represents a six fold increase in global capacity since 2004. (See Figure 3). Annual installations of grid-tied solar PV reached an estimated 5.4 GW in 2008. Spain became the clear market leader, with 2.6 GW of new capacity installed, representing half of global installations and a fivefold increase over the 550 MW added in Spain in 2007. Spains unprecedented surge surpassed former PV leader Germany, which installed 1.5 GW in 2008. Other leading markets in 2008 were the United States (310 MW added), South Korea (200-270 MW), Japan (240 MW), and Italy (200-300 MW).
Markets in Australia, Canada, China, France, and India also continued to grow. The beginnings of growing grid-tied solar PV markets emerged in several countries in 2007/2008, notably China. Including off-grid applications, total PV existing worldwide in 2008 increased to more than 16 GW. Solar PV markets showed three clear trends in 2008. The first was the growing attention to building-integrated PV (BIPV), which is a small but fast-growing segment of some markets, with more than 25 MW installed in Europe. Second, thin-film solar PV technologies became a larger share of total installations. And third, utility-scale solar PV power plants (defined as larger than 200 kilowatts, kW) emerged in large numbers in 2008. By the end of 2008, an estimated 1,800 such plants existed worldwide, up from 1,000 at the end of 2007. Altogether, these plants totaled over 3 GW, a tripling of existing capacity from 2007. The majority of utility-scale plants added in 2008 were installed in Spain (over 1.9 GW added), with others in the Czech Republic, France, Germany, Italy, Korea, and Portugal. The Spanish 60-MW Olmedilla de Alarcon plant, completed in 2008, became the largest solar PV plant in the world. New utility-scale plants are planned and under development in many countries of Europe and throughout the world, including China, India, Japan, and the United States.
Geothermal power
Geothermal power is extracted from heat stored in the earth. This geothermal energy originates from the original formation of the planet, from radioactive decay of minerals, and from solar energy absorbed at the surface. Geothermal electric plants have until recently been built exclusively on the edges of tectonic plates where high temperature geothermal resources are available near the surface. The development of binary cycle power plants and improvements in drilling and extraction technology may enable enhanced geothermal systems over a much greater geographical range.
Geothermal power capacity reached over 10 GW in 2008. The United States remains the world development leader, with more than 120 projects under development in early 2009, representing at least 5 GW. Other countries with significant recent growth in geothermal include Australia, El Salvador, Guatemala, Iceland, Indonesia, Kenya, Mexico, Nicaragua, Papua New Guinea, and Turkey. Geothermal development was under way in over 40 countries, with at least 3 GW in the pipeline beyond the United States. Two new concentrating solar (thermal) power plants (CSP) came online in 2008-the 50 MW Andasol-1 plant in Spain and a 5 MW demonstration plant in California-following three new plants during 2006/2007. A number of additional projects were due to come online in 2009, including two more 50 MW plants and 20 MW of CSP integrated with a 450 MW natural-gas combined-cycle plant in Morocco (which would be the first operational plant of this type). The pipeline of projects under development or construction increased dramatically during 2008, to more than 8 GW by some estimates, with over 6 GW under development in the United States alone. New projects are under contract in Arizona, California, Florida, Nevada, and New Mexico in the United States and under development in Abu Dhabi, Algeria, Egypt, Israel, Italy, Portugal, Spain, and Morocco. A growing number of these future CSP plants will include thermal storage to allow operation into the evening hours. For example, the Andasol-1 plant in Spain has more than seven hours of full-load thermal storage capability, and a 280 MW plant is planned in Arizona with six hours storage.
Overall, renewable power capacity expanded to 280 GW in 2008, a 75-percent increase from 160 GW in 2004, excluding large hydropower. (See Figure 4). The top six countries were China (76 GW), the United States (40 GW), Germany (34 GW), Spain (22 GW), India (13 GW), and Japan (8 GW). The capacity in developing countries grew to 119 GW, or 43 percent of the total, with China (small hydro and wind) and India (wind) leading the increase. A significant milestone was reached in 2008 when added power capacity from renewable in both the United States and the European Union exceeded added power capacity from conventional power (including gas, coal, oil, and nuclear). That is, renewable represented more than 50 percent of total added capacity. (Including large hydropower, global renewable power capacity reached an estimated 1,140 GW in 2008).
Renewable heating markets continued to grow as well. Existing solar hot water and heating capacity increased by 15 percent in 2008 to reach an estimated 145 giga watts thermal (GWth), or double the capacity in 2004. (All figures exclude unglazed swimming pool heating.) China installed three-quarters of global added capacity (14 GWth) and remained the world leader, with more than 70 percent of existing global capacity (See Figures 5 and 6). Solar hot water in Germany set record growth in 2008, with over 200,000 systems installed for an increase of 1.5 GWth in capacity. Spain also saw rapid growth, and the rest of Europe besides Germany added about 0.5 GWth of new capacity. Among developing countries, Brazil, India, Mexico, Morocco, Tunisia, and others saw an acceleration of solar hot water installations.
Geothermal (ground source) heat pumps accounted for an estimated 30 GWth of installed capacity by the end of 2008, with other direct uses of geothermal heat (i.e., for space and greenhouse heating, agricultural drying, industrial, and other uses) reaching an estimated 15 GWth. At least 76 countries use direct geothermal energy in some form.
Fuel ethanol production increased by 34 percent in 2008 to 67 billion liters (See Figure 7). Thus, global fuel ethanol production by 2008 had more than doubled from 30 billion liters in 2004. Fairly stagnant for a number of years, fuel ethanol production in Brazil ramped up dramatically, increasing from 18 billion liters in 2006 to 27 billion liters in 2008. And for the first time ever, more than half of Brazils non-diesel vehicle fuel consumption came from ethanol in 2008. Notwithstanding Brazils achievement, the United States remained the leading ethanol producer, with 34 billion liters produced in 2008. Other countries producing fuel ethanol include Australia, Canada, China, Colombia, Costa Rica, Cuba, the Dominican Republic, France, Germany, India, Jamaica, Malawi, Poland, South Africa, Spain, Sweden, Thailand, and Zambia.
Biodiesel growth rates have been even more dramatic than ethanol, although absolute production is still much less than ethanol. Biodiesel production increased six fold from 2 billion liters in 2004 to at least 12 billion liters in 2008. (See Figure 7 and Table R6.) The EU is responsible for about two-thirds of world biodiesel production, with Germany, France, Italy, and Spain being the top EU producers. By the end of 2008, EU biodiesel production capacity reached 16 billion liters per year. Outside of Europe, top biodiesel producers include the United States, Argentina, Brazil, and Thailand.
Note: The data and curves are taken from different sources.
,,, |
| Total 14 vote(s). | | |
|
|
|
|
 | Messages/Opinions |
|
|
|  | 1)
Priyank Kanade IIT (Bombay)'09 |03/03/10 | replies: 0| Post Reply | | |
Good factual data..
May be we can update it a little with recent govt policies on biofuels.Also economics part can be included.
Priyank Kanade
Mission Newenergy
Send Personal Mail |
|  | 2)
Ajit Bhusari BITS(Pilani)'02 |04/02/10 | replies: 0| Post Reply | | |
Hi Nagendra,
A good article.
I feel, highlighting government s initiatives and promotions would make it complete, else coverage is good,
Ajit
Send Personal Mail |
| | 3)
deepak annadate IIT (Bombay)'80 |15/12/09 | replies: 0| Post Reply | | |
Dear Nagendra,
It is excellent article with data analysis and indicating feasibility of every energy source which is an alternative source to oil and natural gas.
I addition to this, hydrate is also a source of energy which is being considered worldwide.
D.V.ANNADATE
ONGC,Ahmedabad
Send Personal Mail |
|
| |
Click Here to login and post message
|
| Indian Alumni and Students from the following Indian and Global Institutes are invited to be members of 6bridges.com: |
| |
| India |
| Business & Accounting Institutes : FMS, ICAI, IIFT, IIM(A), IIM(B), IIM(C), IIM(I), IIM(K), IIM(L), IRMA(Anand), ISB, JBIMS, MDI(Gurgaon), NITIE, NMIMS, SJMSOM(IIT Bombay), SPJIMR, TISS, XIMB, XLRI |
| Technology Institutes : BIT(Mesra), BITS(Pilani), COE-Guindy(Anna Univ.), DCE, IISc, IIT(B), IIT(M), IIT(D), IIT(G), IIT(K), IIT(Kgp),IIT(Roorkee), ISI(Kolkatta), ISM (Dhanbad), IT-BHU, Jadavpur Univ., National Institutes of Technology(RECs), PSG(Coimbatore), RVCE(Bangalore), VJTI |
| |
| Global |
| Business, Technology & Accounting Universities/Institutes : AGSM(Sydney), AIM(Manila), Caltech, Carnegie Mellon, Columbia, Cornell, Dartmouth, Duke, Georgia Tech, Harvard, ICAEW(UK), IMD(Switzerland), INSEAD, Judge(Cambridge), London Business School, Manchester, Melbourne Business School, Michigan, MIT, Northwestern, NYU, Princeton, Purdue, Queen's(Canada), Said(Oxford), Stanford, U.Chicago, U.Penn, UC Berkeley, UCLA, Univ. of Illinois-Urbana, Univ. of Southern California, Univ. of Virginia, Warwick, Yale |
|
|